
Call Center QA Sampling: Why Reviewing 2% of Calls Answers the Wrong Question
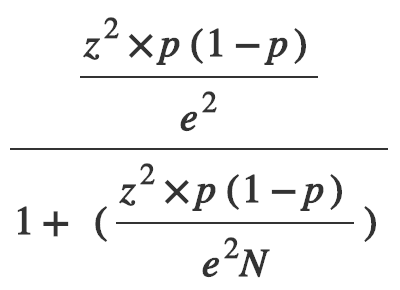
A 2% QA sample is a legitimate statistical instrument. It just answers a different question than the one most QA programs use it for. A random sample of a few hundred calls will estimate your team’s average quality score to within about a point. The same sample cannot tell you whether an individual agent improved this month, and it will miss the large majority of a compliance problem that occurs on 2% of calls. Those are not opinions about sampling. They are properties of the arithmetic, and you can work them out for your own program in about ten minutes.
This article does that arithmetic. Every number below is computed from assumptions stated in the open, so you can substitute your own call volume, score variability, and breach rate and get an answer specific to your floor. If you want to skip the derivations and get a number, the sample size calculator will size a sample for a target confidence level and margin of error.
Sampling is not the problem. The question is the problem.
The case against sampling is usually made badly. “You are only looking at 2% of your calls” is a rhetorical point, not an argument, because sampling is exactly how election polls, manufacturing inspection, and clinical research work. Nobody counts every voter.
What makes those examples work is that the sample is sized against a specific question, and nobody claims more for it than that. Trouble starts when a sample built to answer one question gets used to answer four others.
Contact center quality monitoring has drifted into exactly that. The same handful of calls per agent per month is asked to support:
- How is the team doing overall, and is that changing?
- Is this specific agent performing better or worse than that specific agent?
- Did this agent improve after last month’s coaching?
- Did we miss a required disclosure anywhere this quarter?
- Why did this deal die, or why did this customer churn?
The sample supports question 1 well. It supports question 2 weakly. It cannot support questions 3, 4, or 5 in any meaningful sense, and no amount of care in choosing the sample fixes that, because those questions are not about estimating an average at all.
Here is why, with numbers.
Step one: how many calls per agent do you actually get?
Coverage percentage is the wrong headline number. The number that governs every agent-level conclusion is calls reviewed per agent per month, and the two can come apart badly.
Assumptions for the running example. A 40 agent floor. Each agent handles 500 calls a month, so 20,000 calls total. A thorough manual evaluation takes 20 minutes including the write-up, which is three per productive hour. Two full-time QA analysts get about five genuinely productive review hours a day across 21 working days.
| Quantity | Calculation | Result |
|---|---|---|
| Evaluations per analyst per month | 3/hr x 5 hr x 21 days | 315 |
| Evaluations with two analysts | 315 x 2 | 630 |
| Coverage | 630 / 20,000 | 3.2% |
| Calls per agent per month | 630 / 40 | ~16 |
Note what happened. A perfectly respectable 3.2% coverage number produced 16 calls per agent. Now change one assumption: those analysts also run calibration sessions, handle dispute reviews, and build reports, so half their time goes elsewhere. Coverage becomes 1.6% and the per-agent count becomes 8. Many teams land lower still, at the common “two calls per agent per week” standard, which for a 500 call month is 1.6% coverage and 8 calls per agent.
Everything that follows is driven by that per-agent number, not the percentage.
Step two: the confidence interval on one agent’s score
An agent does not have a score. An agent has a distribution of scores, and any month’s average is a draw from it. Some calls are easy, some are hostile, some hit an auto-fail gate, and the same agent on the same day will produce a 68 and a 94.
Assumption: the standard deviation of a single call’s score is 12 points on a 0 to 100 scorecard. That is a plausible middle for a scorecard with auto-fails and a mix of call types, but it is an assumption, and you should measure your own. Pull any agent’s last 30 scored calls and take the standard deviation. If yours is 18, every interval below gets 50% wider. If yours is 6, they halve.
The 95% confidence interval on an agent’s monthly average is roughly the mean plus or minus t times sigma over the square root of n, where t comes from the t-distribution at n minus 1 degrees of freedom.
| Calls reviewed (n) | Standard error | 95% interval | An agent who scores 80 could truly be |
|---|---|---|---|
| 4 | 6.0 | ±19.1 | 60.9 to 99.1 |
| 8 | 4.24 | ±10.0 | 70.0 to 90.0 |
| 16 | 3.00 | ±6.4 | 73.6 to 86.4 |
| 30 | 2.19 | ±4.5 | 75.5 to 84.5 |
| 100 | 1.20 | ±2.4 | 77.6 to 82.4 |
| 500 (every call) | 0.54 | ±1.1 | 78.9 to 81.1 |
Read the first row again. At four calls a month, an agent reported as an 80 is statistically consistent with a true quality level anywhere from the low 60s to essentially perfect. A 75 and an 85 are not distinguishable. They are not close to distinguishable. Ranking agents on that basis produces a leaderboard whose top and bottom halves would substantially reshuffle if you drew a different random four calls.
At 16 calls, the picture improves to plus or minus about six points. Better, and still wide enough that the difference between your third-ranked and tenth-ranked agent is likely noise.
At full coverage the interval collapses to about a point, because at that point you are not estimating the agent’s performance from a sample. You are measuring it.
Step three: the harder question, did this agent improve?
Comparing two numbers is harder than estimating one, because both numbers carry error. The 95% interval on a month-over-month change is sigma times the square root of 2/n, times t.
| Calls per agent per month | Smallest change you can call real (95%) |
|---|---|
| 4 | ±20.8 points |
| 8 | ±12.9 points |
| 16 | ±8.7 points |
| 30 | ±6.2 points |
| 100 | ±3.4 points |
| 500 (every call) | ±1.5 points |
This is the row that should stop a QA program in its tracks. At 16 calls per agent, the running example’s own number, an agent who moves from 79 to 84 has not demonstrably improved. That five point move sits comfortably inside the ±8.7 band you would expect from two random draws of an unchanged agent.
Which means the standard QA ritual, coach in week one and check the score in week four, is measuring noise most of the time. Half the coached agents will appear to improve and half will appear to regress, on average, whether or not the coaching worked at all. Programs then reinforce whatever the noise happened to say: the manager whose agent bounced up concludes the technique works, the manager whose agent bounced down changes approach. Both learned nothing, and the performance metrics dashboard reported it all with two decimal places.
To detect a genuine five point improvement with any reliability you need roughly 30 to 50 calls per agent per month, which for a 500 call month is 6 to 10% coverage. That is two to five times what most manual programs run.
Step four: rare events, where sampling fails hardest
Everything so far concerned estimating an average, which is the thing sampling is genuinely good at. Rare-event detection is a different problem, and it is where the sampling model breaks rather than merely blurs.
Assumption: a compliance failure, say a missed disclosure, occurs on 2% of calls, and the calls you review are drawn at random. The probability that a sample of n calls contains at least one instance is 1 minus 0.98 to the power of n.
| Sample size (n) | Event on 5% of calls | 2% of calls | 1% of calls | 0.5% of calls |
|---|---|---|---|---|
| 10 | 40.1% | 18.3% | 9.6% | 4.9% |
| 25 | 72.3% | 39.7% | 22.2% | 11.8% |
| 50 | 92.3% | 63.6% | 39.5% | 22.2% |
| 100 | 99.4% | 86.7% | 63.4% | 39.4% |
| 500 | >99.9% | >99.9% | 99.3% | 91.8% |
Each cell is the probability of seeing the problem at least once. At 10 calls per agent, a behavior the agent commits on one call in fifty is invisible more than 80% of the time. Over a full year of monthly reviews at that rate you would expect to catch it roughly twice, which is to say you would probably conclude, from data, that it does not happen.
Now scale it to the floor, where the arithmetic is even cleaner. In the running example, 20,000 calls at a 2% breach rate is 400 breaches in a month. A random sample of 630 calls contains, on average, 0.02 x 630 = 12.6 of them.
A random sample finds exactly your coverage rate’s worth of your violations. 3.2% coverage finds 3.2% of them. That relationship holds for any breach rate and any sample size, which is what makes it the most damning single fact about sampling for compliance. Random sampling is an estimator of prevalence. It is not a detector of incidents, and reading a “0 violations found” QA report as an absence of violations inverts what the instrument does.
For collections work under FDCPA and Regulation F, for legal intake, for healthcare and insurance and financial services, that distinction is the entire ballgame. A missed mini-Miranda on an unreviewed call is still a missed mini-Miranda. The regulator, the plaintiff’s attorney, and the arbitrator all get to look at 100% of the calls. Your QA program is the only party in the dispute working from a sample. That asymmetry is the practical argument for full-coverage compliance checks, independent of anything about AI.
One honest caveat. These figures assume violations are scattered randomly. In reality they cluster: one poorly trained agent commits most of them, and stratified or risk-weighted sampling does better than the table suggests. That is a real and legitimate improvement, and it is why targeted sampling beats random sampling for compliance. But it only helps for risks you already suspect. The failure mode it does not fix is the one you did not know to look for, which is also the one that becomes an enforcement action.
This is the argument for scoring every call against your compliance criteria rather than a sample of them, with an auto-fail gate that catches the missed disclosure on call 4,000 the same way it catches it on call 4. Detection stops being a probability and becomes a property of the system. Try it on one of your own calls free and check it against a criterion you know some of your calls fail.
The questions sampling cannot answer at all
Three of the five questions from the top of this article are not estimation problems, and no sample size fixes them because the operation required is retrieval, not inference.
- “Did we deliver the disclosure on the Henderson account’s calls?” You do not want an estimate. You want those specific calls, all of them. The probability that a given call you care about is in a 3% random sample is 3%.
- “Why did this deal die?” The relevant conversation is one specific call, and the odds it was reviewed are again the coverage rate. This is conversation intelligence territory rather than scoring, and it needs the whole corpus to be searchable, not a sampled subset to be scored. The distinction between scoring and retrieval matters here, and it is worth reading how auto-QA, conversation intelligence and speech analytics actually differ if those terms blur together.
- “What is the actual reason customers are calling this week?” A sample of 16 calls per agent will show you the common reasons and completely hide the emerging one, which by definition starts rare.
A useful test before you ask your QA data anything: am I estimating a rate across many calls, or am I looking for particular calls? Sampling serves the first. Only coverage serves the second.
Coaching from a sample means coaching from calls that may not be representative
There is a subtler cost that sits underneath all of this. Suppose 15% of an agent’s calls are escalations, the calls where the hard skills actually show, and their monthly review is four calls drawn at random.
- Probability of zero escalations in the sample: 0.85 to the 4th, or 52.2%
- Probability of exactly one: 36.8%
- Probability of two or more, which over-represents escalations by 2x or more: 11.0%
So in a typical month, more than half of your agents are coached entirely on routine calls, and about one in nine is coached on a sample that makes their work look harder than it is. Neither manager knows which situation they are in. Both write a development plan with equal confidence.
The same effect drives disputes. When an agent says “you picked my worst calls,” they are sometimes right, and with n=4 you have no principled way to prove otherwise. Full coverage does not eliminate disagreement about a score, but it does eliminate the argument about call selection, which is the argument that damages trust in the program most. This is one reason call scoring at full coverage tends to reduce, rather than increase, agent pushback: the sampling grievance simply disappears.
Be fair: full coverage has its own failure modes
Scoring 100% of calls solves the statistics. It does not solve quality assurance, and pretending otherwise is exactly the vendor optimism this article is arguing against.
Score compression from a weak rubric. If 80% of your criteria pass on nearly every call, most of the score is a constant and the informative variance lives in a couple of criteria. Full coverage then gives you a beautifully precise measurement of something that does not discriminate. Precision is not validity. A rubric that produces a tight band of 88 to 94 for every agent on the floor is broken, and measuring it more often makes it look more authoritative, not more true.
Alert fatigue. In the running example, flagging 3% of 20,000 calls produces 600 flags a month. Nobody triages 600 flags. Coverage without severity tiers, routing, and a threshold discipline turns into a queue everyone learns to ignore, which is functionally the same as not having caught anything. Decide in advance what volume of flags your team can actually action per week, and set thresholds to that capacity.
Measuring what is easy instead of what matters. “Delivered the approved greeting” is trivially detectable. “Understood what the customer actually needed” is not. There is a persistent pull toward loading a rubric with the criteria that score cleanly, which quietly redefines quality as the set of behaviors that are easy to check. Watch the weights, not just the criteria list.
Automation bias. A number with a decimal point invites less scrutiny than a colleague’s opinion, and it should not. Full coverage raises rather than lowers the importance of calibration: reviewers scoring the same call independently and arguing the differences to a written ruling. If a score cannot be traced to a quoted moment in the transcript, it is not evidence, whoever or whatever produced it.
None of these are arguments for going back to four calls a month. They are arguments that coverage is a precondition for a good QA program, not a substitute for one.
What to do with all of this
A defensible design, and none of it is exotic:
- Keep sampling for the question it answers. A few hundred randomly drawn calls a month gives you a team-level average accurate to about a point, and that is a genuinely good trend instrument. In the running example, the team estimate from 630 calls carries an interval of roughly ±1 point. Sampling is not the enemy here. It is doing its job.
- Stop making agent-level decisions from single-digit samples. Before you rank, coach against, or discipline off a score, compute the interval. If your program gives you 8 calls per agent, write ±10 next to every number on the dashboard and see which conclusions survive.
- Move rare-event and compliance checks to full coverage. This is not a preference. It follows from the fact that random sampling detects your coverage rate’s share of incidents and nothing more.
- Make the whole corpus searchable, not just the scored subset. The “which calls mentioned the competitor” and “why did this account churn” questions are retrieval problems and need every transcript.
- Size any sample you do keep against a stated question. Decide the margin of error you can live with first, then compute n. The sample size calculator does the second half; only you can do the first.
- Re-derive these tables with your own numbers. Measure your per-call score standard deviation and your real per-agent review count. If the intervals come out narrower than the ones above, good, and you will know it rather than hoping it.
Most QA programs are running a correctly executed sample against the wrong set of questions, then treating the output as if it answered all of them. The statistics were never hidden. They were just never worked out.
See what full coverage looks like on your own calls
Voxjar does not record calls. It connects to the recordings your phone system already produces, transcribes them, scores every one against your scorecard with the reasoning and the transcript moment attached, and makes the full corpus searchable so the retrieval questions have somewhere to go. That combination, automated QA scoring plus conversation intelligence over the same transcripts, is what removes the sampling constraint rather than just shrinking it.
Run a free AI evaluation on one of your real calls. Upload a recording, apply a scorecard, and see the score, the reasoning, and the evidence in a few minutes. Then run the same numbers from this article against your own program and decide what your sample can honestly support.